|
Plotting Earthquake Hazard Data in MapPoint
This two-part article by Richard Marsden shows how to use MapPoint to produce maps of earthquake hazards and to overlay recent earthquakes using data from the USGS. The technique of depicting data using grids can be used in a wide range of environmental and commercial applications.
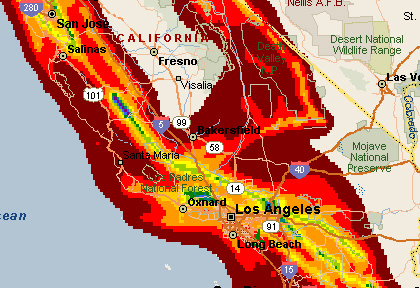
 California earthquakes for the week up to Wed Sep 15 8:22:13 PDT 2004
Recent earthquakes are plotted as solid circles and the color background displays earthquake hazard as calculated by the US Geological Survey (USGS). The hazard data has been plotted using some custom programming, while the recent earthquake data was prepared with Excel and plotted using MapPoint�s Data Import Wizard. We will look at the earthquake hazard data first.
The Earthquake Hazard Data
This was prepared using a custom C++ program, but the code could also be adapted to work in any language that can call MapPoint (e.g. VB6). Alternatively, a third party data import tool such as Grid Imp could be used.
If programming MapPoint in C++ without MFC is new to you, then you should look at the article Calling MapPoint From C++ Without the MFC Safety Net first.
I will assume that you have a working project with the required mpinterface.h, etc. files in place.
The earthquake hazard data was calculated by the USGS and is available from
http://eqhazmaps.usgs.gov/. Go to the 2003 conterminous gridded data at http://eqhazmaps.usgs.gov/html/data2002.html and download the �PGA 10% PE in 50 years� file ( ftp://ghtftp.cr.usgs.gov/pub/hazmaps/data2003/ascii/USpga500v6.asc ).
This file estimates the peak ground accelerations expected at the 10% probability level in the next fifty years. Peak ground acceleration (PGA) is related to the force applied to a building by an earthquake, so this is a better measure of earthquake hazard than the �Earthquake Index� provided with MapPoint 2004 North America. This is a large file (20MB) but covers the entire conterminous US at a resolution of 0.5 degrees.
Open the file in a text editor. The data consists of three columns, one each for longitude, latitude, and PGA. The first line contains titles for each column. Delete this first line.
To read the file, I created a new C++ class called FileDataReader. The header is as follows:
// FileDataReader.h header file

#include
using namespace std;

class FileDataReader
{
public:
  FileDataReader(char* fname);
  virtual ~FileDataReader();

  bool EndOfFile();
  void Close();
  bool ReadTriplet(double& lng, double& lat, double& z);


// Private Members
private:
  ifstream myStream;
};
This is a pretty simple class, but is capable of parsing an individual line as well as simple file management (open/close, end of file). The implementation is as follows:
// FileDataReader.cpp: implementation of the FileDataReader class.

#include "stdafx.h"
#include "FileDataReader.h"


FileDataReader::FileDataReader(char* fname)
{
  myStream.open(fname, ofstream::in);
}

FileDataReader::~FileDataReader()
{
}

bool FileDataReader::EndOfFile()
{
  return myStream.eof();
}

void FileDataReader::Close()
{
  myStream.close();
}


bool FileDataReader::ReadTriplet(double& lng, double& lat, double& z)
{
  // Simple read of a triplet file. Values separated by whitespace.
  // Return true if EOF or other error occurs
  // If the EOF occurs at the very end, then report as Good (false).
  myStream >> lng;
  if (!myStream.good())	return true;

  myStream >> lat;
  if (!myStream.good())	return true;

  myStream >> z;
  return myStream.fail() || myStream.bad();
}
The data is read one line at a time, and plotted if required. Plotting and MapPoint control is managed by a second class called MapPointController. The include file is as follows:
// MapPointController.h: interface for the MapPointController class.

#if _MSC_VER > 1000
#pragma once
#endif // _MSC_VER > 1000

#include "FileDataReader.h"

// Number of colors in the colormap
#define NUM_COLS 11

class MapPointController
{
public:
  MapPointController();
  virtual ~MapPointController();

	void CreateGridSquares(	FileDataReader& myReader,
      const double minLong, const double maxLong,
      const double minLat, const double maxLat,
					const double gridSize,
      const double min_val, const double max_val
);

// Auxiliary Methods
private:
	double CalcLongitude( const double lng ) const;

// Private member: Colormap to use
	long	colormap[NUM_COLS];
};
The implementation for MapPointController is a little more involved, and is described here in sections. First we have the required includes, and we also tell C++ that we are using the MapPoint namespace.
// MapPointController.cpp: implementation of the MapPointController class.
//////////////////////////////////////////////////////////////////////

#include "stdafx.h"
#include "MapPointController.h"

#include "mpinterfaces.h"
#include "FileDataReader.h"

using namespace MapPoint;
Next we have the constructor and destructor for the MapPointController object.
The only initialization required is for the colormap array, which stores the required colormap. Each color is stored as a long value with one byte for each of the RGB components. The colormap here contains 11 colors making a rainbow scheme. You may adapt this as required, but remember to update the NUM_COLS definition in MapPointController.h if required. Also note that MapPoint limits the colors to a palette of about 36. These are listed in a bitmap provided with MapPoint and in the Appendix of
http://www.mapping-tools.com/gridimp/wxm_formatspec.doc.
//////////////////////////////////////////////////////////////////////
// Construction/Destruction
//////////////////////////////////////////////////////////////////////


MapPointController::MapPointController()
{
// NUM_COLS = 11
	//              RED    GREEN        BLUE
	colormap[ 0] = 0x80 + 0x00 * 256 + 0x00 * 65536;
	colormap[ 1] = 0xFF + 0x00 * 256 + 0x00 * 65536;
	colormap[ 2] = 0xFF + 0x99 * 256 + 0x00 * 65536;
	colormap[ 3] = 0xFF + 0xCC * 256 + 0x00 * 65536;
	colormap[ 4] = 0xFF + 0xFF * 256 + 0x00 * 65536;
	colormap[ 5] = 0x99 + 0xCC * 256 + 0x00 * 65536;
	colormap[ 6] = 0x00 + 0x80 * 256 + 0x00 * 65536;
	colormap[ 7] = 0x00 + 0x80 * 256 + 0x80 * 65536;
	colormap[ 8] = 0x33 + 0x66 * 256 + 0xFF * 65536;
	colormap[ 9] = 0xFF + 0x00 * 256 + 0xFF * 65536;
	colormap[10] = 0x80 + 0x00 * 256 + 0x80 * 65536;
}

MapPointController::~MapPointController()
{
}
Next we define an auxiliary method to check that the longitude coordinate is within range. MapPoint longitude values must be in the range of �180 to +180. This is necessary if you use a different dataset, for example the file for Alaska crosses the International Date Line.
double MapPointController::CalcLongitude( const double lng ) const
{
	double l(lng);
	while (l> 180.0)	l-=360.0;
	while (l<-180.0)	l+=360.0;
	return l;
}
Next we come to the main controller method that calls MapPoint to create grid squares from the input data. It is called with an opened FileDataReader object to read the data from. The extents of the output grid are also provided as minimum/maximum longitude and latitude values. The grid size is also provided (0.5 degrees for this data file). A range of data values to plot are also provided. This can be used so that areas of minimal hazard are not plotted.
void MapPointController::CreateGridSquares( FileDataReader& myReader,
    const double minLong,
    const double maxLong,
    const double minLat, const double maxLat,
    const double gridSize,
    const double min_val, const double max_val
						)
Next we start MapPoint and initialize our range variables.
{
	// Start MapPoint
	_ApplicationPtr myMapPointPtr;
	HRESULT hr = myMapPointPtr.CreateInstance("MapPoint.Application.NA");
	if (hr != 0)
{
    MessageBox(NULL, "Could not open Microsoft MapPoint!",
    "demo: CreateGridSquares", MB_SETFOREGROUND);
    return;
	}

	_Application*	myMapPoint = (_Application*)myMapPointPtr;
	ATLASSERT( myMapPoint != NULL );

	// Set MapPoint to be visible, and to stay open after this program closes
	myMapPoint->Visible = true;
	myMapPoint->UserControl = true;

	// Get a pointer to the _Map object
	_MapPtr myMapPtr = myMapPoint->ActiveMap;
	_Map* myMap = (_Map*)myMapPtr;
	ATLASSERT( myMap!=NULL );

	double halfGridSize = gridSize * 0.5;
	double minLatR = minLat  - halfGridSize;
	double maxLatR = maxLat  + halfGridSize;
	double minLonR = minLong - halfGridSize;
	double maxLonR = maxLong + halfGridSize;
Next we start a loop, reading each data point in turn and plotting it if it is within the required longitude, latitude, and z (hazard) values.
// Loop over each data point, reading it in
while ( !myReader.EndOfFile() )
{
// Read data point
double lng,lat,z;
if ( myReader.ReadTriplet( lng,lat, z) ) break;
// Is it in the output range?
if ( lng > minLonR && lng < maxLonR &&
lat > minLatR && lat < maxLatR )
if ( z>min_val && z
At this point in the program , we have found a data point which meets the requirements so we will plot it. The data point is plotted as a grid square centered on the point location. The grid square is created by creating a closed solid polyline, described using a VARIANT array of Location objects. The z (hazard) value is used to find the required color from the colormap. The finished polygon has a solid fill but no edge line and is positioned behind the roads.
// Draw square
VARIANT vcoords;
VariantInit( &vcoords );
V_VT(&vcoords) = VT_DISPATCH + VT_ARRAY;
SAFEARRAYBOUND saBound[ 1 ] ;
saBound[ 0 ].cElements = 5 ;
saBound[ 0 ].lLbound = 0 ;
SAFEARRAY FAR* coords = SafeArrayCreate( VT_DISPATCH, 1, saBound ) ;
V_ARRAY(&vcoords) = coords;
long idx[ 1 ] ;
LocationPtr locPtr1 = myMap->GetLocation( lat-halfGridSize,
CalcLongitude(lng-halfGridSize), 100.0 );
Location* myLoc1 = (Location*)locPtr1;
ATLASSERT(myLoc1!=NULL);
idx[ 0 ] = 0;
HRESULT hr = SafeArrayPutElement( coords , idx , locPtr1) ;
ATLASSERT(hr==0);
LocationPtr locPtr2 = myMap->GetLocation( lat+halfGridSize,
CalcLongitude(lng-halfGridSize), 100.0 );
Location* myLoc2 = (Location*)locPtr2;
ATLASSERT(myLoc2!=NULL);
idx[ 0 ] = 1;
hr = SafeArrayPutElement( coords , idx , locPtr2) ;
ATLASSERT(hr==0);
LocationPtr locPtr3 = myMap->GetLocation( lat+halfGridSize,
CalcLongitude(lng+halfGridSize), 100.0 );
Location* myLoc3 = (Location*)locPtr3;
ATLASSERT(myLoc3!=NULL);
idx[ 0 ] = 2;
hr = SafeArrayPutElement( coords , idx , locPtr3) ;
ATLASSERT(hr==0);
LocationPtr locPtr4 = myMap->GetLocation( lat-halfGridSize,
CalcLongitude(lng+halfGridSize), 100.0 );
Location* myLoc4 = (Location*)locPtr4;
ATLASSERT(myLoc4!=NULL);
idx[ 0 ] = 3;
hr = SafeArrayPutElement( coords , idx , locPtr4) ;
ATLASSERT(hr==0);
idx[ 0 ] = 4;
hr = SafeArrayPutElement( coords , idx , locPtr1) ;
ATLASSERT(hr==0);
ShapePtr myShapePtr = myMap->Shapes->AddPolyline( vcoords );
Shape* myShape = (Shape*)myShapePtr;
long color = colormap[ (int)( (z-min_val+1.0)*NUM_COLS /
(max_val-min_val) )
];
myShape->Fill->Visible = true;
myShape->Fill->ForeColor = color;
myShape->Line->Visible = false;
myShape->ZOrder(geoSendBehindRoads);
// Tidy this shape up
myShapePtr.Release();
locPtr1.Release();
locPtr2.Release();
locPtr3.Release();
locPtr4.Release();
}
// Loop around to the next line of data
}
The data has been read in and plotted, now close the file and release the remaining MapPoint pointers.
// Close the input file, release the COM objects and finish
myReader.Close();
myMapPtr.Release();
myMapPointPtr.Release();
}
That is it for the MapPointController class. For my sample program, I used a simple dialog box, and wired the OK button to perform the drawing. The implementation for the drawing was as follows:
// Create a FileDataReader object using the earthquake file
// Change the path to point to the location of the file on your computer
FileDataReader myInput("C:\\Projects\\maps\\eq\\demo\\Debug\\USpga500v6.asc");
// If the file was opened successfully, create the grid squares
if (!myInput.EndOfFile())
{
MapPointController myController;
// Plot areas of California & Nevada with PGA > 20.0
myController.CreateGridSquares( myInput, -124.50, -114.01, 32.55,
42.01, 0.05, 20.0, 140.0 );
// Here are some other example areas that work for the same dataset
// myController.CreateGridSquares( myInput, -123.30,-120.86, 36.70,38.56,
0.05, 140.0 ); // SF Bay Area
// myController.CreateGridSquares( myInput, -94.45,-85.64, 33.0,41.86,
0.05, 20.0, 140.0 ); // New Madrid Fault Zone
}
// Close the input file
myInput.Close();
When you build this and run it, you will find that it is quite slow due to the large amount of data being read and processed. A number of optimizations can be applied, but the above code has been kept simple to show the basic concept. The Grid Imp product by from Mapping-Tools.com uses the same concept but runs much faster due to optimizations. It is also much more flexible, being capable of reading a variety of file types, as well as supporting different grid spacings and data holes.
The final map should like this:
Next month MP2K Magazine will be featuring the second part of this part which will show how to display recent earthquakes, also using publicly available, free information from the USGS.
Discuss this story in the forum.
 Author: Richard Marsden Author: Richard Marsden
Email: enquiries(AT)winwaed.com
URL: http://www.winwaed.com
Richard Marsden is the proprietor of Winwaed Software Technology, LLC
which provides software consulting and development services,
specializing in both MapPoint and online mapping applications. He
operates the Mapping-Tools.com
Website for MapPoint Tools and Utilities, and recently launched
the GeoWeb Guru a community
website for developers of the geospatial web.
In 2008, Richard was awarded Virtual Earth MVP status by Microsoft.
Prior to Winwaed, Richard worked as a software developer working on
seismic processing algorithms for the oil exploration industry. He holds
geology and geophysics degrees from the University of Cambridge
(Churchill College), and the University of Durham; and an
interdisciplinary MBA from the University of Dallas.
|