|

|
|

|
Using Python to Control MapPoint, Part 2Second of a two-part article by Richard Marsden on scripting MapPoint using Python. In this part Richard shows how to use Python to plot the �250 largest cities in California�.
In Part 1, I showed how Python could be used to control MapPoint. Python is a scripting language that is ideally suited to text processing. Hence it can be used as a replacement for MapPoint�s Data Import Wizard in situations that require some processing intelligence. As an example, we will use it to plot the �250 largest cities in California�. Our source data is the US Census Bureau�s 2000 Gazetteer of Places. This file (places2k.txt) and format specification can be found here: http://www.census.gov/geo/www/gazetteer/places2k.html The data file is a text file, with one line per place. A place is typically a town or city, although it may also be a CDP (Census Designated Place) � ie. an unincorporated town. Each line follows a fixed column format, and includes information such as location (longitude, latitude), area, and population. So let�s get started with some Python! First we import the required libraries and MapPoint COM information:
# Import the required libraries
import string
from win32com.client import constants, Dispatch
MAPPOINT = 'MapPoint.Application.NA.11'
Python supports object oriented programming. This lets us represent a city�s information in the form of a simple object with only a constructor and some data members. This constructor takes a line of text (read from the data file) and creates a city object.
# This is a helper function used by the CityInfo constructor
def removeSuffix( str, suffix):
    idx = string.rfind(str,suffix)
    if (idx>-1):
        return str[0:idx]
    else:
        return str


# This class stores and handles a city's information
class CityInfo:
    def __init__(self, sline):
        self.state = sline[0:2]
        self.city = string.strip(sline[9:73])
        self.population = string.atol(sline[73:82])
        self.housing = string.atoi(sline[82:91])
        self.land_area = string.atof(sline[119:131])
        self.water_area = string.atof(sline[131:143])
        self.latitude = string.atof(sline[143:153])
        self.longitude = string.atof(sline[153:164])
        # trim the extra city/town/CDP/village off the end
        self.city = removeSuffix(self.city, " (balance)")
        self.city = removeSuffix(self.city, " city")
        self.city = removeSuffix(self.city, " CDP")
        self.city = removeSuffix(self.city, " town")
        self.city = removeSuffix(self.city, " borough")
        self.city = removeSuffix(self.city, " village")
        self.city = removeSuffix(self.city, " comunidad")
        self.city = removeSuffix(self.city, " municipality")
        self.city = removeSuffix(self.city, " zona urbana")
Note that Python�s tabulation is important. If a statement leads into a block, it ends with a �:� and the members of the block are tabbed. So in the above code, the
class
The city name needs a bit more work. Unlike the fixed 2 character State code, city names can have a variable length and are hence padded
out with space characters. The call to
We will store the cities in arrays, but we also need to sort them. The array�s
# comparison function to compare according to population
# Note that this is a reverse comparison: returns greatest first
# used for sorting
def sortByPopulation( a, b):
    return cmp( b.population, a.population )
Now we can start with the main code. First, we must read all the city data. These are stored as
######################################
# Main Code

citiesByState = {}
print "Example US Census Program: Reading data..."

# You will probably need to change the following path
cFile = open('c:\\Projects\\census\\places2k.txt', 'r')
city_line = 'empty'

city_line = cFile.readline()
while len(city_line) > 0 :
    thisCity = CityInfo( city_line )

    if (not citiesByState.has_key(thisCity.state) ):
         citiesByState[thisCity.state] = []
    citiesByState[thisCity.state].append(thisCity)

    # fetch next line (and loop)
    city_line = cFile.readline()

cFile.close()
print "US census data has been read"
This code simply loops over each line, reading it in and creating a After reading all these cities, we can perform a variety of actions � for example extract cities with specific population densities. However, here we simply want the 250 largest cities in California. So first, we get a reference to the list of California cities, and then sort them by population:
print "Sorting the California cities by population..."
myCities = citiesByState[ "CA" ]
myCities.sort(sortByPopulation)
Now that we have the cities sorted in order of population (largest first), we can extract the first 250 and plot them in MapPoint. Calling MapPoint in Python was covered in Part 1 of this article. Here is the city plotting code:
print "Starting MapPoint and creating pushpins..."

# start MapPoint, with a new map
myApp = Dispatch(MAPPOINT)
myApp.NewMap
myApp.Visible = 1
myMap = myApp.ActiveMap

# Loop over each city of these 250 cities, creating a pin for each
for iCity in range(250):
    thisCity = myCities[iCity]
    thisLoc = myMap.GetLocation( thisCity.latitude, thisCity.longitude)
    myPin = myMap.AddPushpin( thisLoc, thisCity.city )
    myPin.Symbol = 52

# Tidy Mappoint up, leaving MapPoint open for the user to see
myApp.UserControl = 1
myMap = 0
myApp = 0

print "Finished!"
The Python This is what the resulting map looks like:
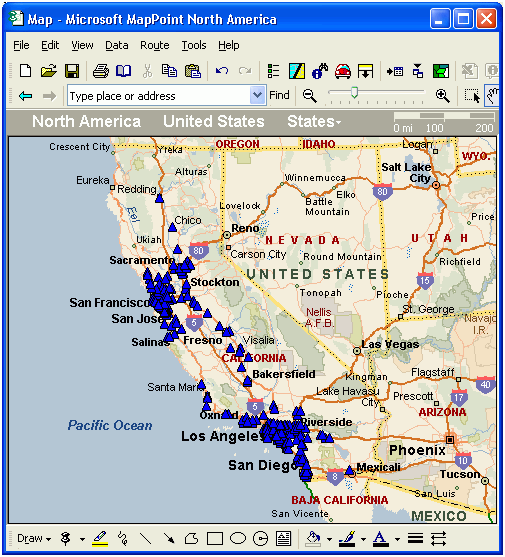
Click on the map to view the full screenshot A similar script was combined with the Single State Mapper to produce the maps used on http://www.mileage-charts.com/cities/index.shtml. Further Reading "Learning Python", Mark Lutz & David Ascher, Publ. O�Reilly.
 Author: Richard Marsden Author: Richard MarsdenEmail: enquiries(AT)winwaed.com URL: http://www.winwaed.com Richard Marsden is the proprietor of Winwaed Software Technology, LLC which provides software consulting and development services, specializing in both MapPoint and online mapping applications. He operates the Mapping-Tools.com Website for MapPoint Tools and Utilities, and recently launched the GeoWeb Guru a community website for developers of the geospatial web. In 2008, Richard was awarded Virtual Earth MVP status by Microsoft. Prior to Winwaed, Richard worked as a software developer working on seismic processing algorithms for the oil exploration industry. He holds geology and geophysics degrees from the University of Cambridge (Churchill College), and the University of Durham; and an interdisciplinary MBA from the University of Dallas.
|
|
||||||||||||||||||||||||||||||||||||||||||||||||||||||||||||||||||
|
|
||||||||||||||||||||||||||||||||||||||||||||||||||||||||||||||||||||